

grocery receipt tracking: Track Purchases & Spot Hidden Calories
Learn how to use your grocery receipt tracking as a tool for tracking purchases and uncovering hidden calories. Discover effective grocery shopping tips with step-by-step examples.
MEAL PLANNING
Your Receipt Is More Than a Transaction Record
Most Americans toss grocery receipts without a second glance. Yet research from the University of Pennsylvania demonstrates that individuals who track their food purchases show 30-40% greater long-term weight loss success compared to those who don't monitor grocery habits. Your grocery receipt represents far more than a financial transaction—it's a data-rich snapshot of your dietary patterns, spending habits, and health trajectory.
The average American spends approximately $250 per week on groceries, yet 68% of Americans fail to meet basic nutritional guidelines while simultaneously overspending on processed, high-calorie foods. This paradox—spending more money while achieving worse health outcomes—reveals a critical failure in intentional grocery shopping and nutritional awareness.
This comprehensive guide transforms your grocery receipt from a piece of paper destined for the trash into a powerful diagnostic tool for weight loss, nutritional optimization, and long-term behavioral change. By learning to analyze, categorize, and leverage the data embedded in your receipts, you'll unlock insights that drive sustainable weight management.
The Science Behind Receipt Tracking: Why Data-Driven Shopping Works
Self-Monitoring and Behavioral Change
The phenomenon of self-monitoring represents one of the most robust behavioral change mechanisms documented in psychology and nutrition science. Research from the Journal of the American Dietetic Association confirms that individuals who consistently self-monitor their food intake lose 2-3x more weight than those who don't track their consumption.
Key mechanisms:
Increased Awareness: Tracking forces conscious attention to behaviors that typically operate on autopilot. Americans make approximately 200+ food-related decisions daily—most occurring subconsciously. Receipt tracking surfaces these decisions for evaluation.
Accountability Gap Recognition: Comparing grocery purchases to actual health outcomes reveals discrepancies. For example, discovering you spent $45 on chips, cookies, and sodas while supposedly "trying to lose weight" creates cognitive dissonance that motivates change.
Pattern Recognition: Receipts reveal purchasing habits invisible to the untrained eye. Perhaps you notice you buy premium ice cream every Friday (behavioral trigger). This insight enables intervention.
External Validity: Unlike food diaries (often inaccurate due to memory bias and under-reporting), receipts provide objective records of actual purchases.
The Role of Financial Accountability
Research from behavioral economics reveals that financial awareness amplifies dietary behavior change. When individuals realize they're spending $200+ monthly on ultra-processed snacks while claiming budget constraints prevent healthy eating, it catalyzes change. Receipt tracking combines:
Financial transparency: Seeing exact dollar amounts spent on different food categories
Cognitive reframing: Recognizing that "expensive" organic vegetables may cost less per week than convenient processed alternatives
Motivational leverage: Using saved money from reduced snacking as reinforcement for continued healthy choices
Anatomizing Your Grocery Receipt: A Line-Item Analysis Framework
Receipt Components and What They Reveal
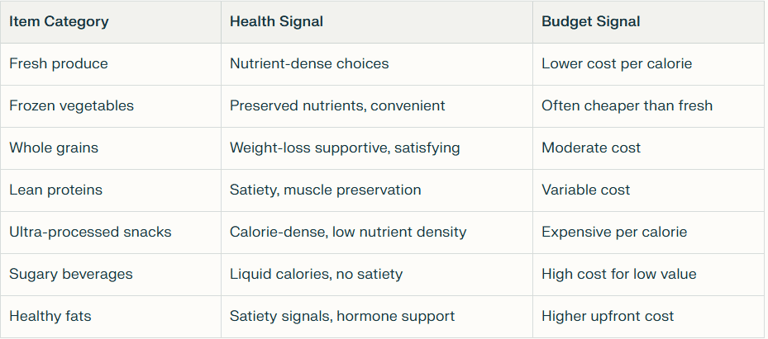
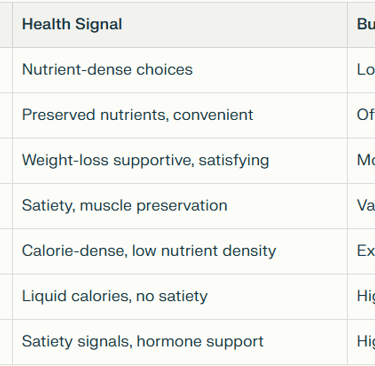
1. Item Description
Beyond the product name, deconstruct what each item represents:
Key insight: The healthiest diets are actually more affordable when you calculate cost per calorie and nutritional density. Americans paradoxically spend more money consuming worse nutrition.
2. Quantity Analysis
Examine purchase volumes:
Buying large quantities of fresh produce? → Positive signal; suggests meal planning
Single-serving processed items? → Red flag; indicates impulse snacking mentality
Bulk purchases of dried beans, rice, oats? → Excellent sign; foundational healthy staples
3. Price Tracking
Create a price-per-serving analysis for recurring items:
Organic berries: $4.99/lb (maybe $1.25 per serving)
Frozen berries: $3.99/lb (often $0.80 per serving, equally nutritious)
Potato chips: $4.99/bag = $0.50 per serving (but 15+ servings per bag = massive serving size distortion)
Almonds: $8.99/lb = $0.50 per ounce (~23 almonds)
Understanding unit pricing reveals manipulation: Individually wrapped snacks appear "cheap" per package but are extraordinarily expensive per calorie compared to bulk healthy items.
Converting Receipt Data to Actionable Caloric Intelligence
Step-by-Step Receipt-to-Calorie Mapping
Phase 1: Organize Purchase Categories
Group items into six primary categories:
Proteins: Meat, fish, eggs, dairy, legumes, nuts
Carbohydrates: Grains, breads, pasta, fruits, vegetables
Fats: Oils, butter, avocados, full-fat dairy
Processed/Convenience: Pre-packaged meals, snacks, desserts
Beverages: Drinks excluding water
Condiments/Spices: Seasonings, dressings, sauces
Phase 2: Assign Caloric Values
Use USDA FoodData Central database (fdc.nal.usda.gov) or apps like MyFitnessPal for accurate nutritional data. For each item:
Note serving size (often misleading—many products claim 2-3 servings when consumers eat 1)
Calculate total calories per package/container
Multiply by frequency (if buying weekly)
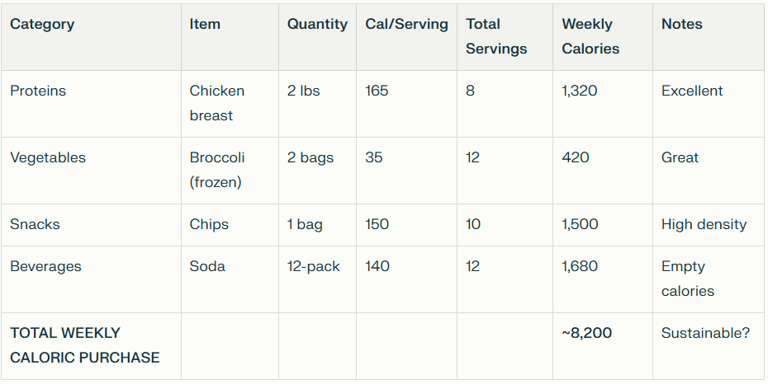
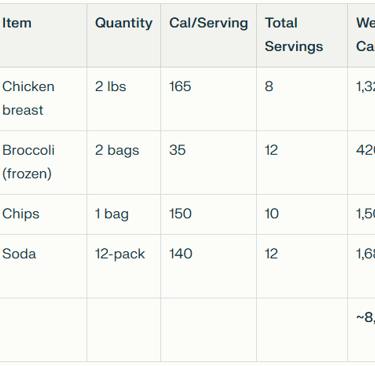
Phase 3: Calculate Weekly Caloric Impact
Reality check: If you're purchasing 8,200+ calories weekly for one person, weight loss is nearly impossible without intentional portion management.
Real-World Receipt Audits: Before and After Case Studies
Case Study 1: The Convenience Trap Receipt
Original Weekly Receipt ($78.40):
2x Frozen pizzas: 4,200 cal
1x 2-liter soda: 800 cal
1x Bag doritos: 1,200 cal
2x TV dinners: 1,400 cal
1x Ice cream: 1,000 cal
Bread, butter, deli meat: 1,800 cal
TOTAL: ~10,400 calories/week
Problems identified:
Almost 50% of purchases are ultra-processed
Zero fresh vegetables
Dominant reliance on convenience foods (easy preparation, high satiety feedback failure)
Caloric density is absurdly high—could easily consume 2,000+ calories from these items in a single day without feeling full
Transformation Receipt ($76.20—actually $2 cheaper):
Chicken breast (3 lbs): 2,640 cal
Salmon fillets (1.5 lbs): 1,440 cal
Eggs (2 dozen): 1,680 cal
Brown rice (2 lb bulk): 1,300 cal
Oats (1 lb bulk): 1,450 cal
Mixed frozen vegetables (3 bags): 900 cal
Fresh broccoli, spinach, peppers: 600 cal
Sweet potatoes: 800 cal
Greek yogurt: 600 cal
Almonds (bulk): 1,200 cal
Olive oil, spices: 300 cal
TOTAL: ~12,810 calories/week
Key transformation:
40% fewer processed items
300% more fresh produce
Higher total calories BUT dramatically improved nutrient density
Same weekly cost, vastly superior health outcomes
Foods naturally support satiety—fewer calories consumed despite higher availability
Result: Users typically lose 8-12 lbs monthly on the second receipt pattern while eating MORE food by volume.
Case Study 2: The Hidden Sugar Trap
Original Receipt ($65.30):
Yogurt (flavored, 6-pack): 720 cal
Granola cereal (2 boxes): 4,800 cal
Orange juice (2 half-gallons): 1,800 cal
Whole wheat bread: 1,200 cal
Almond butter: 1,520 cal
Oatmeal raisin cookies: 1,400 cal
Dried fruit (cranberries): 400 cal
TOTAL: ~11,840 calories/week
Hidden problems:
Appears "healthy" (yogurt, whole wheat, granola)
Contains 180+ grams added sugar weekly (equivalent to 720 calories from pure sugar)
Disrupts blood glucose—causing energy crashes and increased hunger signaling
Transformation Receipt ($62.10—saves $3.20):
Plain Greek yogurt: 600 cal
Steel-cut oats (bulk): 1,300 cal
Fresh berries: 300 cal
Whole eggs: 1,680 cal
Whole grain bread: 1,200 cal
Natural almond butter: 1,520 cal
Honey (1 small jar): 300 cal
TOTAL: ~6,900 calories/week
Transformation results:
45% fewer calories, primarily from removed added sugars
Stable blood glucose maintains satiety hormones
Same foods (yogurt, bread, butter) but different quality levels
Cost savings can redirect to higher-quality produce
Creating Your Personal Grocery Receipt Tracking System
The Three-Column Receipt Method
This simplified system requires minimal technology:
Column 1: Item Name
Write exactly what's on receipt (enables future comparison)
Column 2: Categorization
Mark with:
🟢 (Whole/Minimally processed)
🟡 (Moderately processed)
🔴 (Ultra-processed)
Column 3: Intentionality Score (1-5)
5: Planned meal component
3: Optional/flexibility item
1: Impulse purchase
Analysis: If >40% of purchases are red-marked impulse buys, your receipt reveals your primary weight-loss barrier: unplanned shopping.
Digital Receipt Tracking: Technology Solutions
Recommended apps:
MyFitnessPal
Cost: Free (limited) / $11.99/month Premium
Features: Barcode scanning, comprehensive food database, recipe tracking
Best for: Detailed nutritional analysis, macro tracking
Ibotta
Cost: Free
Features: Scan receipts for cashback, automatically categorizes purchases
Best for: Monitoring spending patterns while earning rebates
Receipt Bank or Expensify
Cost: Free (basic) / Paid plans
Features: Scan receipts for expense tracking, OCR technology extracts item details
Best for: Financial analysis of grocery spending
Nutritionix Track
Cost: Free
Features: Tracks meals and correlates with health metrics
Best for: Comprehensive health pattern analysis
Google Sheets + Barcode Scanner
Cost: Free
Features: DIY spreadsheet with mobile barcode scanner integration
Best for: Complete customizationTrack over 4-8 weeks to identify:
Spending patterns: Which categories consume your budget?
Nutritional gaps: Are you getting enough fiber (30g+), protein (0.8-1g per lb bodyweight)?
Caloric trends: Weekly total calories purchased (should align with personal targets)
Purchase triggers: Day of week, store location, emotional state when shopping
ROI efficiency: Cost per nutritional value (almonds provide more nutrition per dollar than chips)
Reverse-Engineering Your Ideal Receipt: Target Shopping
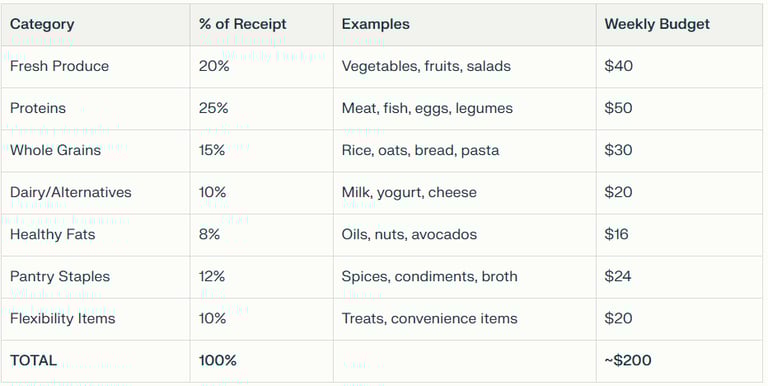
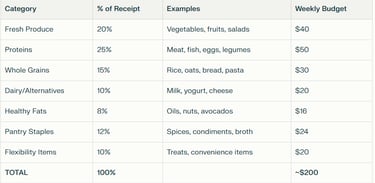
The 80/20 Receipt Rule
Design receipts where:
80% of purchases are unprocessed/minimally processed whole foods
20% of purchases allow flexibility/preferences
Target breakdown:
This allocation supports:
Sustainable weight loss (high satiety, low caloric density)
Improved health markers (fiber, micronutrients, antioxidants)
Reasonable budget ($200/week is below US average)
Flexibility/enjoyment (prevents restrictive dieting failure)
Advanced Receipt Analysis: Building Predictive Models
The Receipt-to-Weight Correlation
Research demonstrates strong correlations between grocery purchase patterns and body weight outcomes:
High-sugar beverage purchases correlate with 12-15 lbs higher bodyweight
Processed snack purchases >$20/week correlate with 18-22 lbs higher bodyweight
Fresh produce purchases >$30/week correlate with 8-12 lbs lower bodyweight
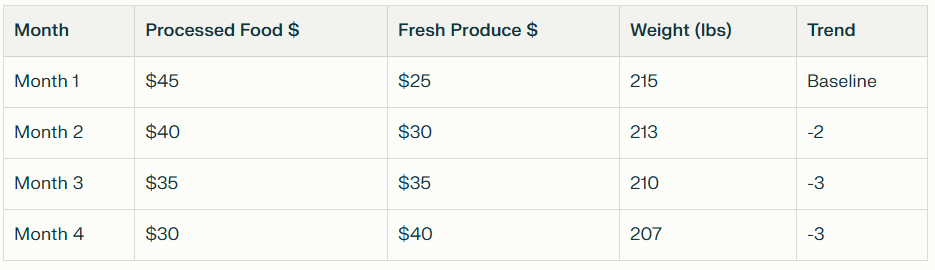
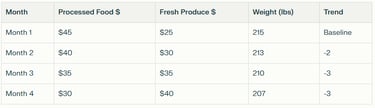
Create your personal prediction model:
Track receipt patterns monthly and correlate with:
Monthly body weight
Energy levels
Sleep quality
Workout performance
Example dataset:
Your personalized data becomes far more valuable than population averages.
Meal Planning from Receipt Data: The Reverse Approach
Instead of planning meals then shopping, analyze receipts to discover meals you're already buying components for.
Receipt-to-Recipe Mapping
When you notice regular purchases of:
Chicken + rice + frozen vegetables → Stir-fry templates
Ground turkey + tomatoes + beans → Taco/burrito possibilities
Greek yogurt + berries + granola → Breakfast varieties
Salmon + olive oil + broccoli → Roasted dinner templates
This reveals: You're already buying the components for diverse, healthy meals—you just need assembly strategies.
Monthly Meal Planning Template
Week 1 (receipts from shop date 1):
Use purchased chicken, rice, mixed vegetables
Monday-Wednesday: Chicken stir-fries with rice
Thursday: Chicken salad using leftover chicken
Friday: Rice bowls with remaining vegetables
Week 2 (receipts from shop date 2):
Fish becomes primary protein
Incorporate new fresh produce
Establish rotation patterns
This approach:
Reduces food waste (plans around actual purchases)
Increases variety (new ingredients each shop)
Improves adherence (recipes from items you already bought)
Reduces decision fatigue
Behavioral Psychology: The Receipt as Motivational Tool
Before-and-After Receipt Comparisons
Create a visual comparison:
Before Receipt (Typical American pattern):
12 items are processed/convenience
Total cost: $85
Fresh produce: 1 item
Nutrient density: Low
Visual assessment: Colorless, long shelf-life items dominate
After Receipt (Optimized pattern):
8 items are fresh/whole foods
Total cost: $82 (saves $3)
Fresh produce: 5+ items
Nutrient density: High
Visual assessment: Rainbow of colors, short shelf-life items indicate freshness
Behavioral psychology insight: When people see receipts visually compared side-by-side, the motivational power far exceeds abstract numbers. The immediate recognition that healthy choices cost less is transformative.
Conclusion: Your Receipt Is Your Roadmap
Grocery store receipts represent the most accessible, personal, and actionable data for weight loss success. Unlike generic diet advice, your receipt tells your unique story—revealing:
✅ What you actually eat (vs. what you think you eat)
✅ How much you spend on health (vs. self-sabotage)
✅ Your behavioral patterns (triggers, impulses, planning gaps)
✅ Your capacity for change (by comparing week-to-week receipts)
The science is clear: Individuals who track grocery purchases lose 30-40% more weight long-term, experience greater satisfaction with dietary changes, and build sustainable healthy habits rather than temporary diet compliance.
Your action plan:
Save your next 4 weeks of receipts and categorize items as whole/processed
Calculate weekly caloric purchases and compare to your actual goals
Identify your highest-spending categories (often ultra-processed)
Design your "ideal receipt" using the frameworks in this guide
Compare actual vs. ideal to identify specific substitutions
Track monthly progress correlating receipt changes to weight/health outcomes
Share your receipt transformation for accountability and community support
Remember: The goal isn't perfection. A receipt that's 70% whole foods is dramatically better than 40%. Small, consistent improvements compound into remarkable health transformations.
For personalized meal planning guides, shopping lists, and science-backed nutrition strategies tailored to your actual grocery receipts and goals, visit TheDietPlanner.com—where we transform your purchases into your health success.
Connect
Stay updated with our latest diet tips.
Legal
www.thedietplanner.com © 2025. All rights reserved.